What a Gantt shows, and what it leaves out
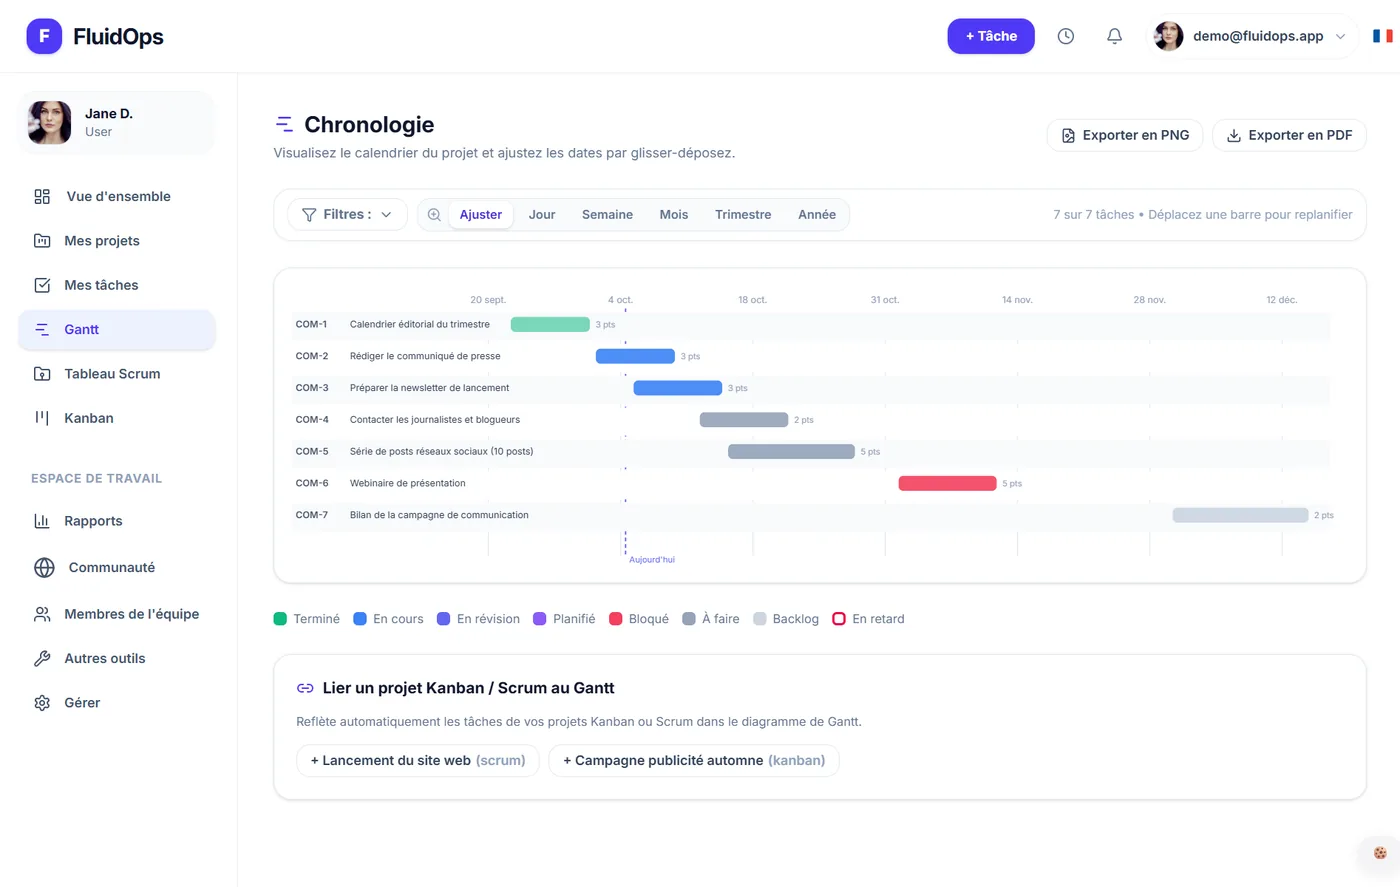
A Gantt chart places each task on a timeline: a horizontal bar between its start date and its end date. Milestones mark the key moments and dependencies link the tasks that condition one another. The tool is over a century old: in 2003, James Wilson devoted a centenary tribute to it in the European Journal of Operational Research (Wilson, 2003).
What it does not show: the team's mood, the value delivered, or how uncertain each date is. A Gantt alone does not move a project forward. It makes it steerable, provided you read it alongside the task board and progress figures.

Reading it in three seconds
- The "today" line. A task planned to the left of the line that is not finished is late. The bar is often colored accordingly.
- Status colors. Done, in progress, planned, blocked: you spot the essentials without opening a single card.
- Bar length. A three-week task probably hides several tasks. Split it to see what is going on.
Building a Gantt you can trust
Honest dates
We underestimate how long our tasks will take, even when we know similar tasks have overrun before: that is what Buehler, Griffin and Ross show (1994). For uncertain tasks, look at how long the previous ones took instead of relying on your gut, and add a visible buffer.
Few dependencies
Every arrow is a constraint. Link only what truly depends on something else; the rest can run in parallel.
One milestone per deliverable
A milestone every week dilutes attention. One milestone per deliverable, with a written success criterion, gives landmarks people actually stick to.
The real challenge: keeping it up to date
A Gantt updated by hand once a month becomes scenery: nobody looks at it, so nobody corrects it. A chart generated from the project's tasks is better, so that moving a card moves the bar.
Sources
- Wilson, J. M. (2003). Gantt charts: A centenary appreciation. European Journal of Operational Research, 149(2), 430-437. econpapers.repec.org
- Buehler, R., Griffin, D., & Ross, M. (1994). Exploring the "planning fallacy": Why people underestimate their task completion times. Journal of Personality and Social Psychology, 67(3), 366-381. doi:10.1037/0022-3514.67.3.366